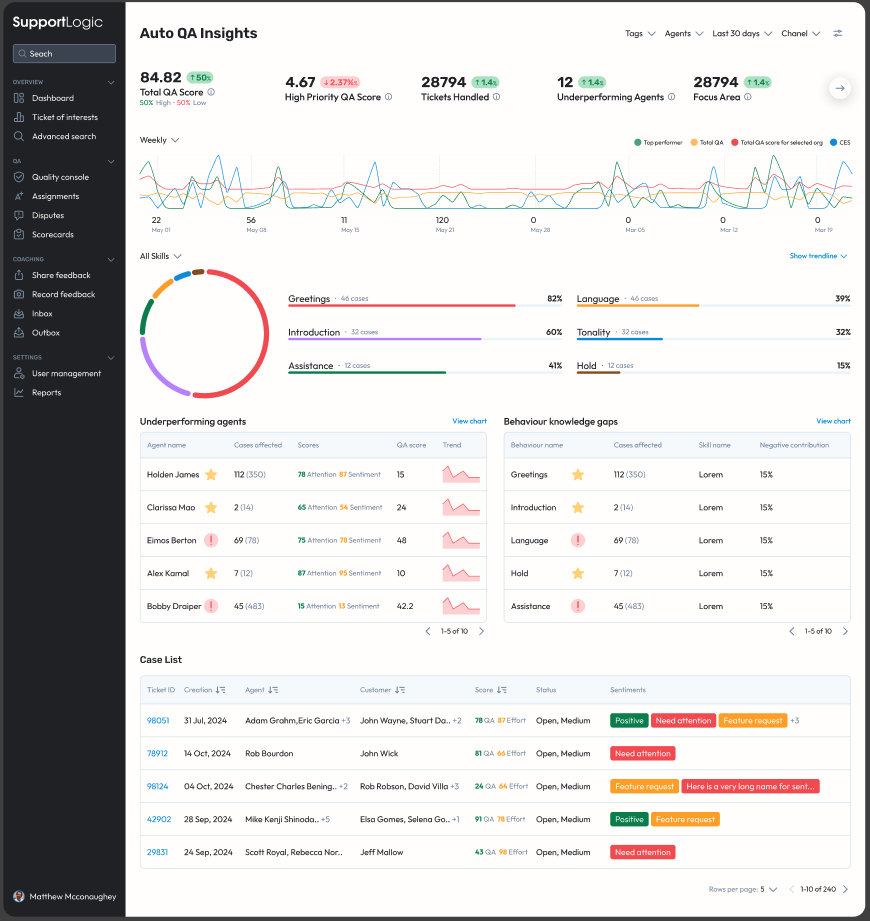
The all new AutoQA Insights page provides a consolidated, data-driven view of your org’s AutoQA performance. It enables you to understand quality trends, identify performance patterns across agents and teams, and drill down into specific cases that contribute to your overall QA scores.
This page brings together score summaries, performance trends, and detailed case-level data — all in one place — to help you make informed decisions about coaching, quality improvements, and process optimisation.
Apart from a clear contribution analysis for your org's AutoQA scores, for the first time in Elevate - you will soon see trends for individual behaviors and skills and not just for the overall QA score.
Page Overview & Layout
The Auto QA Insights page is structured to give both a high-level summary and detailed analytical views in a single, scrollable layout. From top to bottom, the page is divided into the following sections:
Data Cards – key metrics and summary scores
Score Trends – visualising QA performance over time
Contribution Analysis – understanding what drives your QA score
Category-Level Insights – tables and charts for each key metric and focus area
Case List – detailed view of all cases contributing to the scores above
1. Data Cards
At the top of the page, the Data Cards provide a snapshot of your key performance metrics.
Each card highlights an important data point such as:
Total QA Score - Overall QA Score
High Priority QA Score - QA score comprising of only the high priority cases
Tickets Audited - Total number of cases audited
Focus Area - Name of Behaviour that has the least contribution towards QA score
CES - Customer Effort Score
AutoQA Overrides - Total number of manual overrides done to AutoQA scores
Most Overridden Behaviour - The name of the behaviour that is overridden the most

These cards offer a quick, at-a-glance summary of how your organisation is performing at the current point in time.
2. Score Trends
Beneath the data cards is the Score Trends chart, which visualises changes in your Auto QA scores across a selected time period. Along with the overall QA score, this chart also plots the:
Total QA Score for selected Org (Virtual Org)
Customer Effort Score
Top performing agent

You can hover on any point of the chart to view the case contribution for that specific period as well.
3. Contribution Analysis
The Contribution Chart explains what drives your overall QA score. This visual breaks down how the individual skills, or behaviours contribute to the total Auto QA score — helping you pinpoint which areas have the most impact on your quality outcomes.
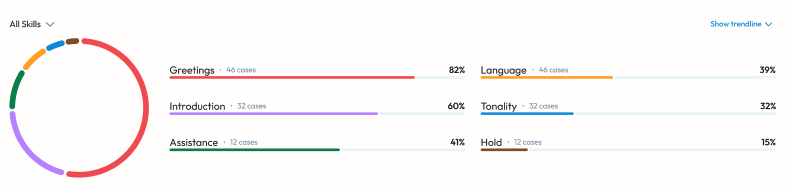
In addition, you can deep dive into each Skill and view the contribution of each Behavior towards each Skill.

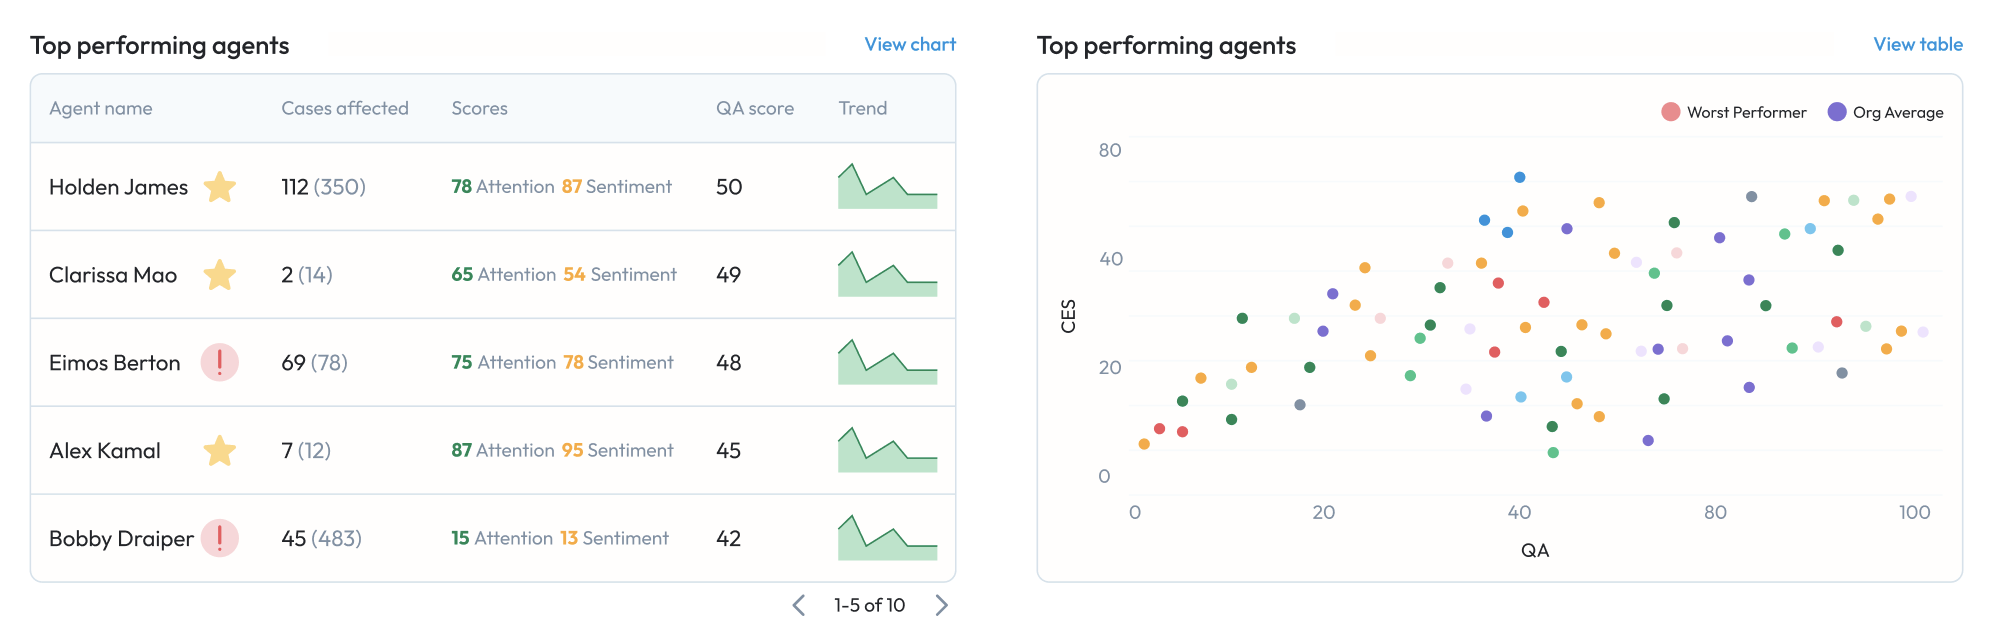
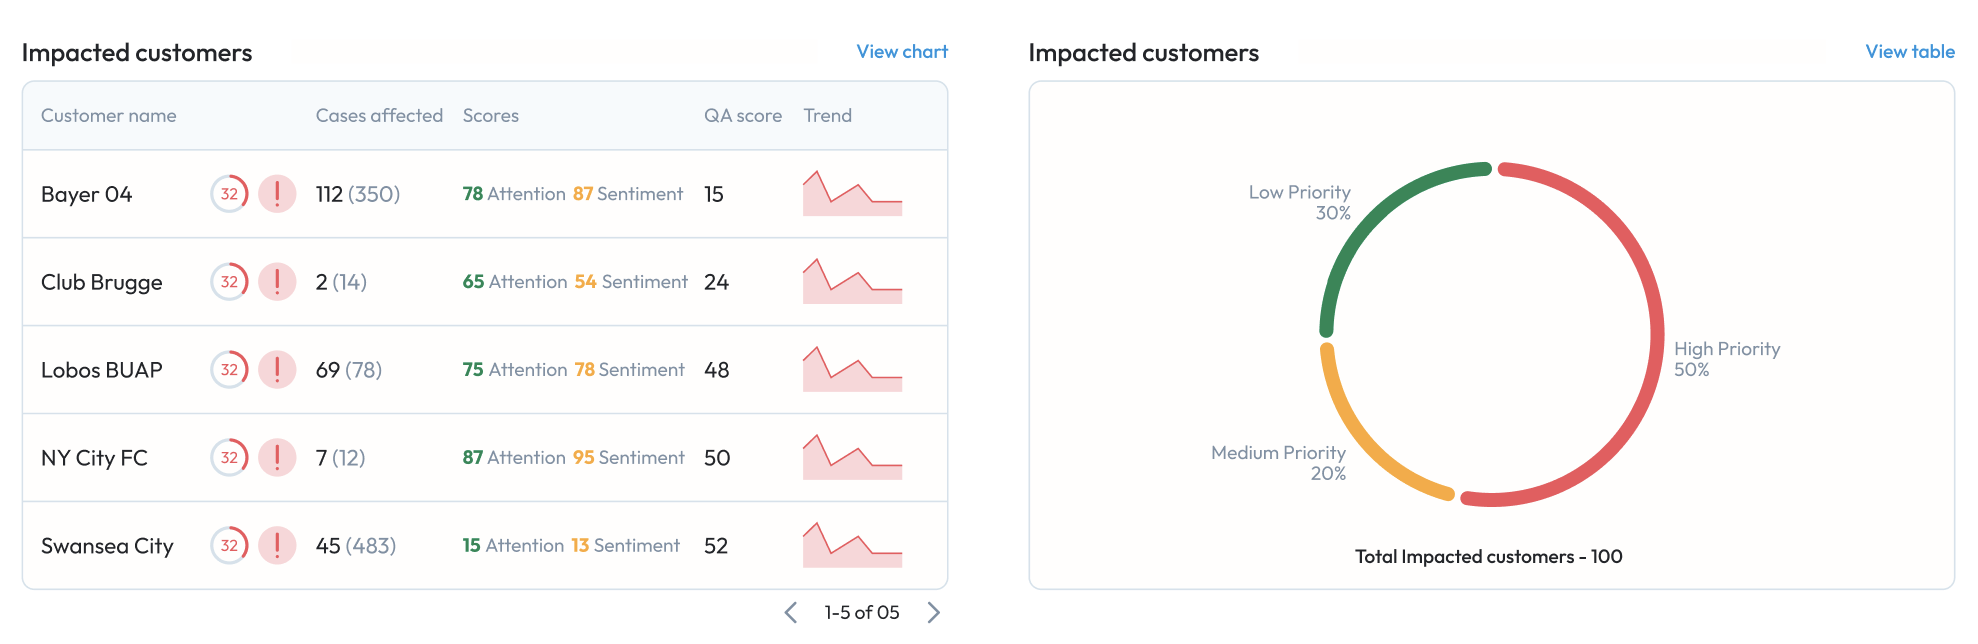
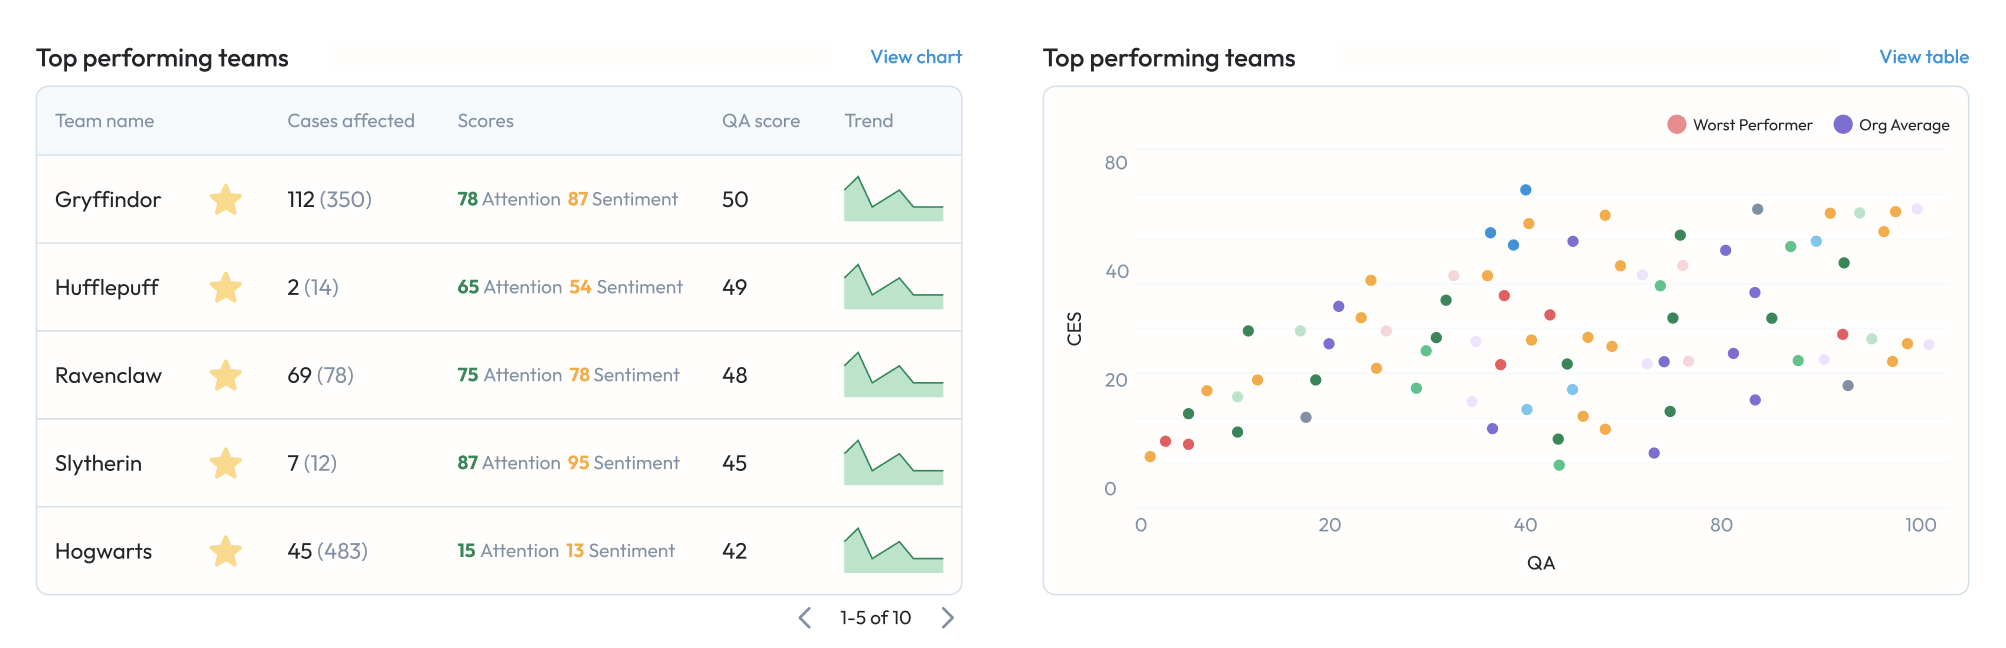
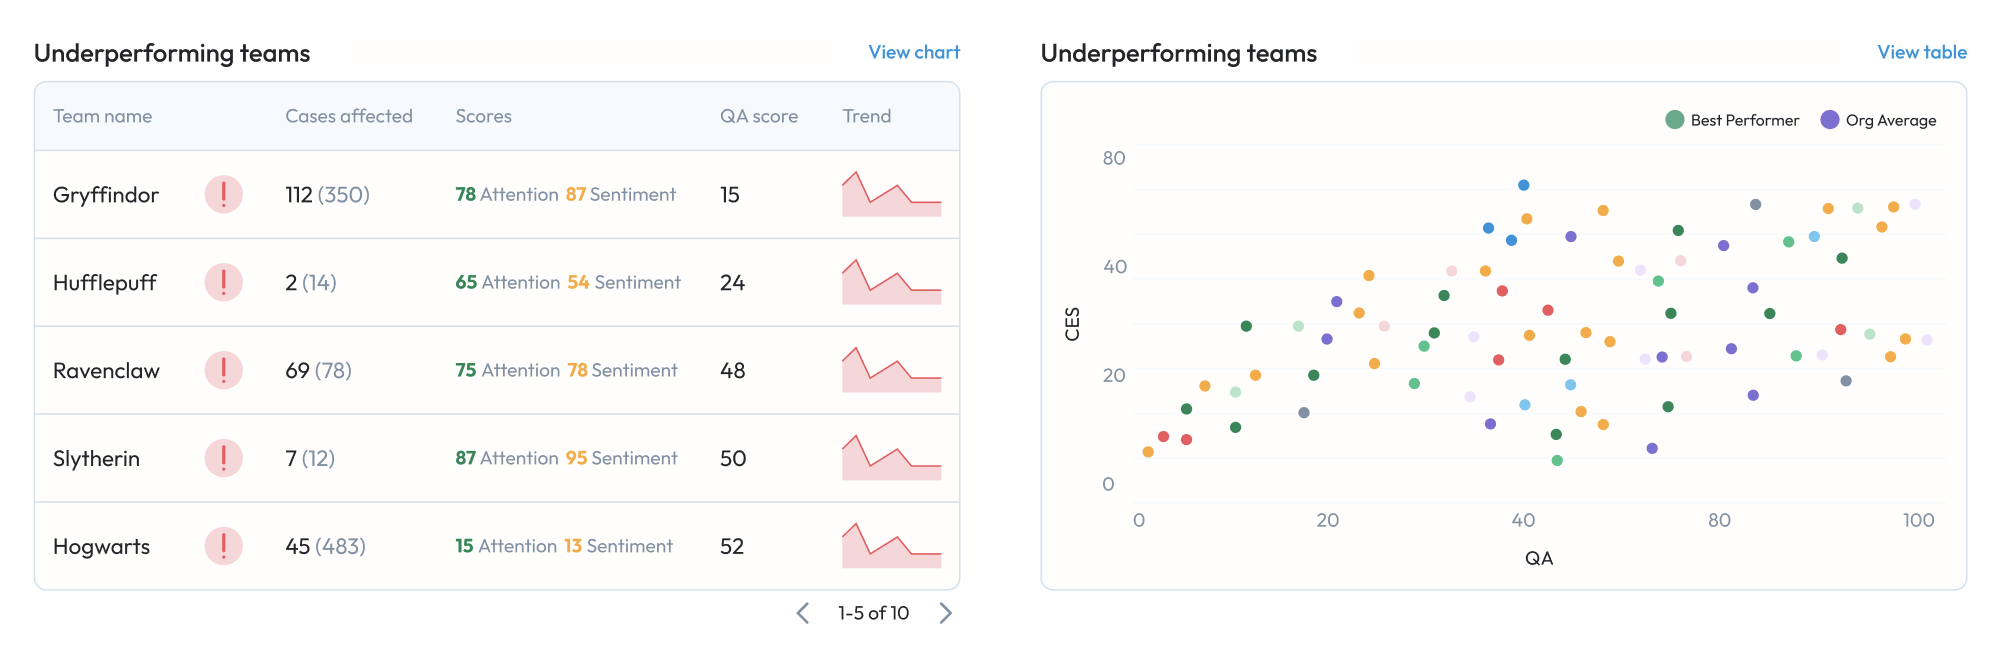
4. Category-Level Insights
Following the contribution chart, the page displays a series of tables and charts that focus on specific aspects and key focus areas of performance. Each section pairs a table with a visual chart to make it easier to interpret key insights. Typical sections include:
Underperforming Agents - List of agents with the lowest QA scores
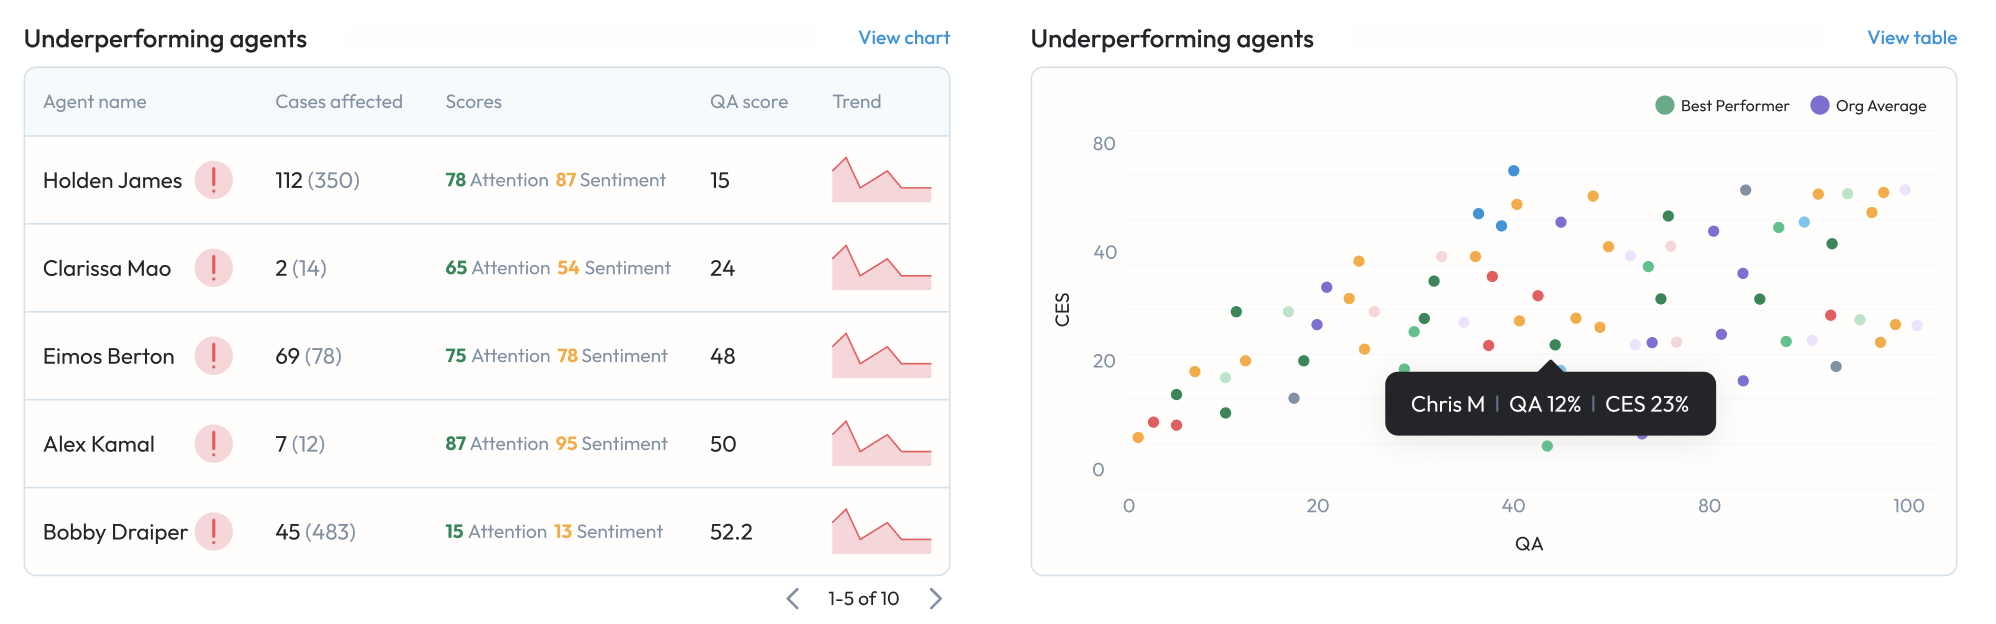
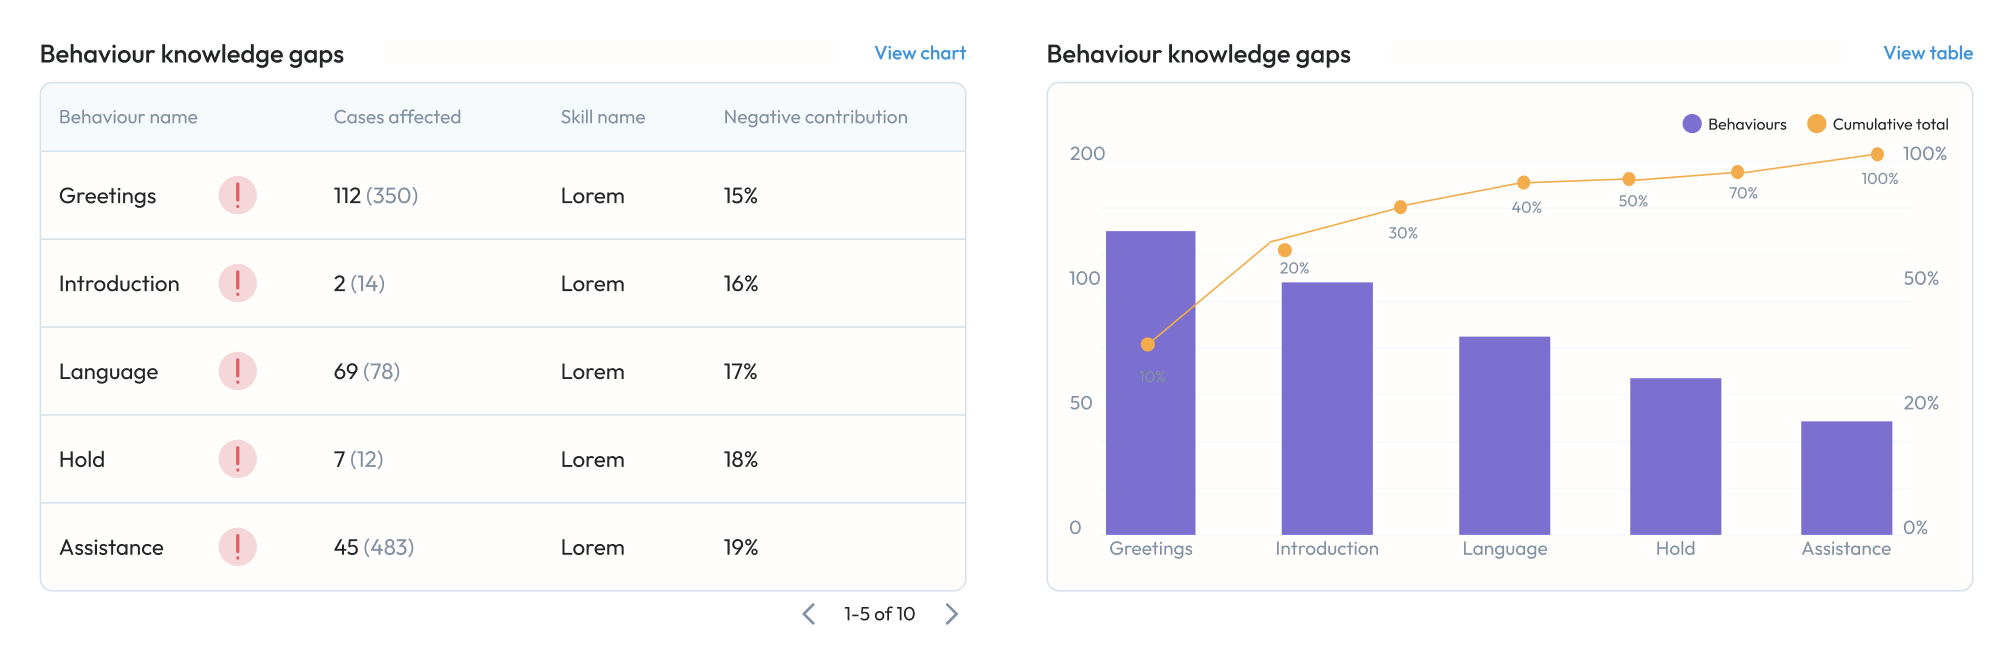
Knowledge Gaps - List of behaviours with the lowest contribution towards QA scorse
Top performing agents - List of agents with the highest QA scores
Impacted Customers - List of customer/account names that have the lowest QA scores
Top performing teams - List of teams with the best QA scores
Underperforming teams - List of teams with the worst QA scores
Contributing Factors - List of case metadata associated with a case that have the worst QA scores
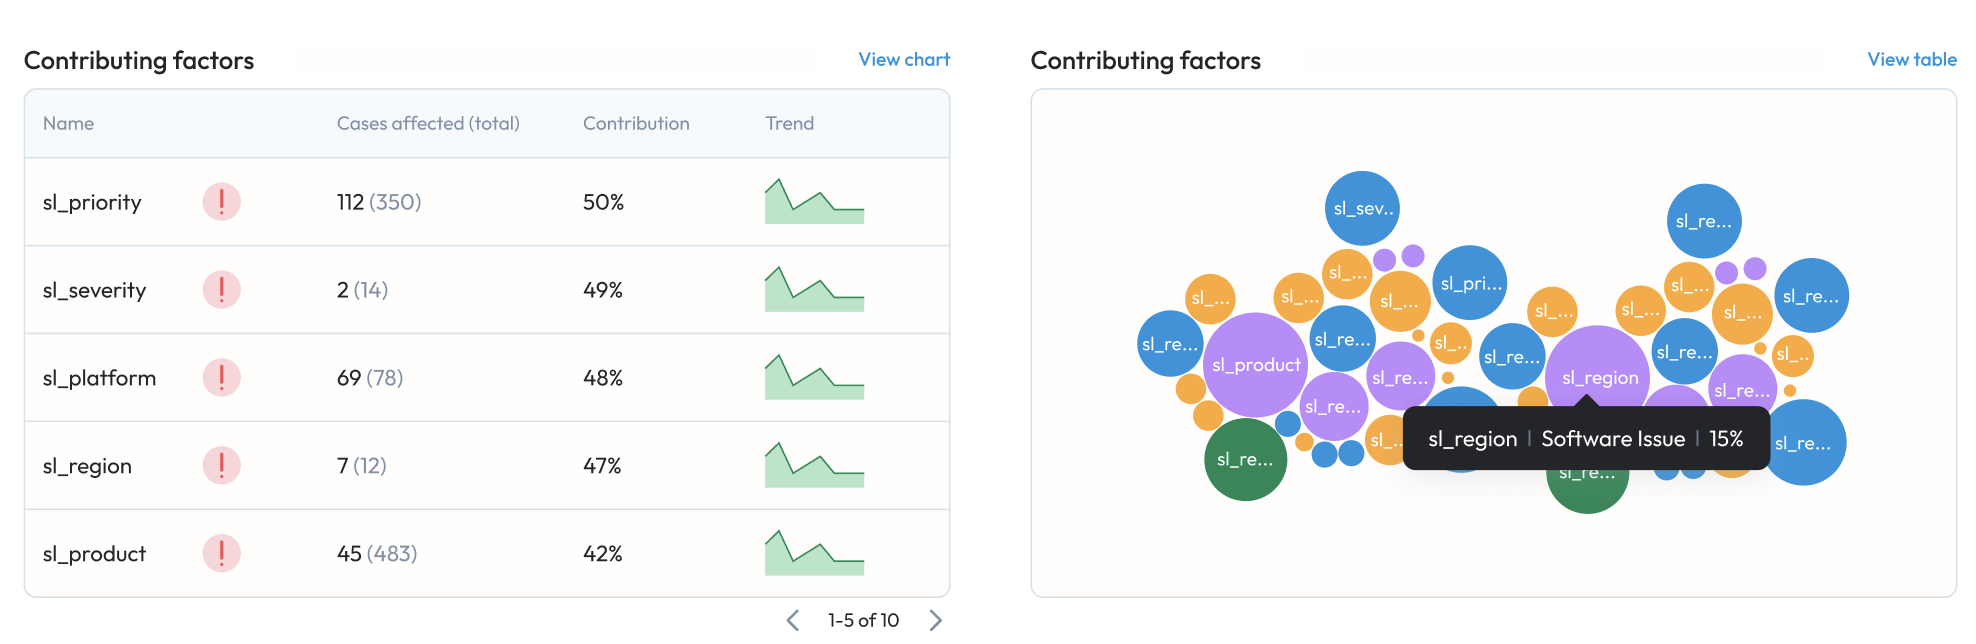
In addition, each table has a few features coming soon:
- Indicator for consistent performances - to understand which agents/teams/metadata is repeated performing well or badly
- A corresponding chart that clearly represents the board in a visual manner, making it very easy to consume the information!
5. Case List
At the bottom of the page is the Case List, which displays every case contributing to the overall Auto QA scores shown above. Each entry in this list includes:
Case ID
Customer name
Agent name
Audit or creation date
QA and CES scores
Detected signals

Using Auto QA Insights
The Auto QA Insights page is designed to be both diagnostic and actionable.
You can use it to:
Track quality trends over time.
Identify coaching opportunities for specific agents or teams.
Understand which factors most influence QA outcomes.
Drill down to case-level details for context and validation.
There is are a lot of key updates coming for this page in the coming weeks - so stay tuned for more!
Was this article helpful?
That’s Great!
Thank you for your feedback
Sorry! We couldn't be helpful
Thank you for your feedback
Feedback sent
We appreciate your effort and will try to fix the article