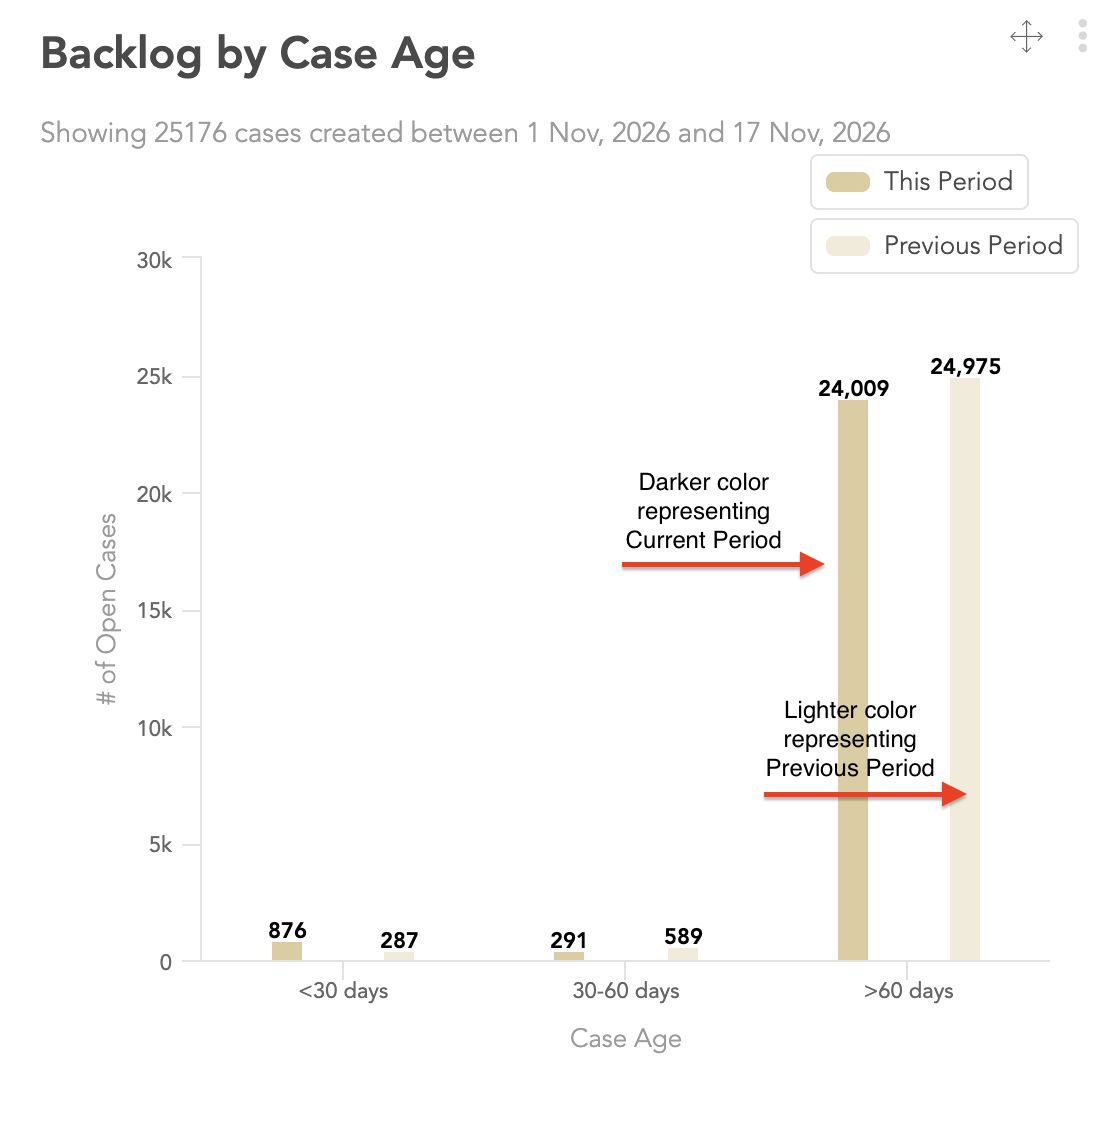
In SupportLogic trend reports and analytics, the percentage increase or decrease (period-over-period change) is measured against the Previous Period — specifically, the immediately preceding time window of equal duration to the currently selected period.
For example: If you choose 1 month as a date range for this filter, the trend graph will be shown for this month(darker shade/bold line) vs the previous month(lighter shade / dotted line).
Was this article helpful?
That’s Great!
Thank you for your feedback
Sorry! We couldn't be helpful
Thank you for your feedback
Feedback sent
We appreciate your effort and will try to fix the article